Tuesday, October 29, 2013

Lab #8

Apologies professor for being a few minutes late. This was the first time I used illustrator on a mac and i had a heck of a time trying to export an image that would work on blogger as it would not read the image files created by illustrator. This version was made by exporting a pdf and then exporting that to a jpg.

Tuesday, October 22, 2013

Lab #7


Lab #6

The most obvious differences are in the colors when comparing the digital version to the printed version. The color scheme for the states appear darker on the printed version for the most part with the exception of the background. The background actually seems to be lighter on the printed version. There is a color shift when comparing the two maps and it becomes far more noticeable as you move towards the darker colors. The lighter colors appear most similar between the two copies. When I look at the web version, though I liked the background color at the time of creation, I think that would be something I would explore more to setup a better feel between the map color scheme and the background.

Monday, October 14, 2013

Blog #5

I chose this picture because it is amazing the amount of trouble the disaster in Fukushima has cause. The color scheme basically depicts the percentage chance that the vegetation in the area has levels of 0.24Bq/kg of Cesium 137, essentially radioactive waste from the fallout. While these levels have been shown from Chernobyl studies to not be of major detriment to humans, a loss of vegetation may have a large impact on the population.

http://www.esri.com/news/arcuser/1012/modeling-contamination-using-empirical-bayesian-kriging.html

Wednesday, October 9, 2013

Blog #4

This is a choropleth map showing changes in mortality rate for women in the United States. It is interesting to note that there seems to be a solid trend line that moves from the northwest of the U.S. through the Central U.S. down south and then back up a little. Metropolitan areas seem to be seeing improvement more than worsening which is an interesting note.

 http://www.pophealth.wisc.edu/research-news/2013-03-12-0

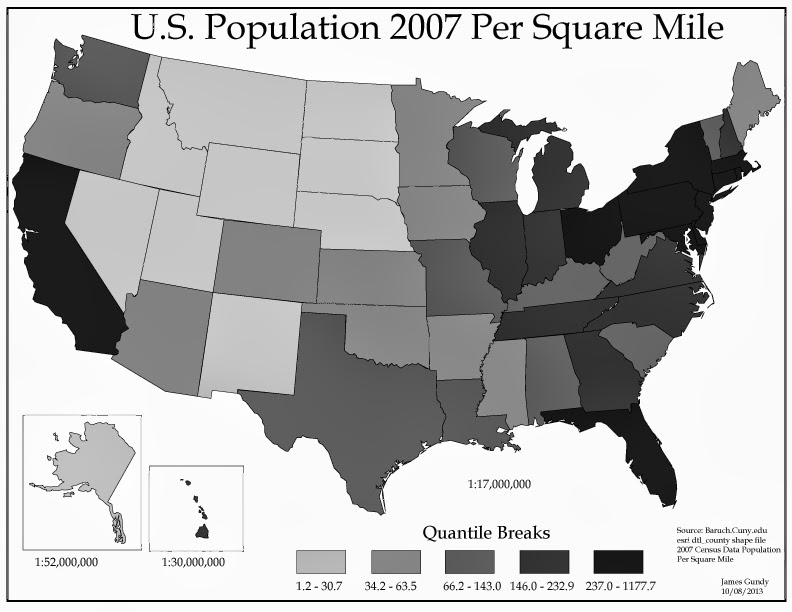
Tuesday, October 8, 2013

GGS 310 Lab #5

Interesting to see how the data changes when using different data classification. Natural breaks is a more accurate measure in this case. The even distribution of quantile makes the map seem more diverse if only because of the number of data sets per classification.